¶ Portfolio history
- At this page you can check important metrics from portfolio history

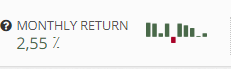
¶ 1. Monthly return
- This is the monthly return that portfolio had within the given time period
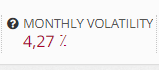
¶ 2. Monthly volatility / standard deviation
- This is plain volatility on monthly basis for this portfolio
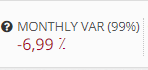
¶ 3. Monthly VaR
- An estimated percentage VaR value for one month period @ 99% confidence level
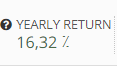
¶ 4. Yearly return
- Average yearly return for a given portfolio calculated from history returns
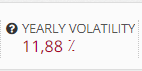
¶ 5. Yearly volatility
- Same as Monthly volatility only measured on a yearly basis
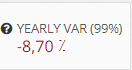
¶ 6. Yearly VaR
- Same as Monthly VaR only estimated on a yearly basis
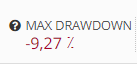
¶ 7. Max Drawdown
- Max drawdown show maximum drawdown from a highest peak in this portfolio
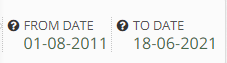
¶ 8. From date & to date
- Shows the period when the data was backtested for this portfolio
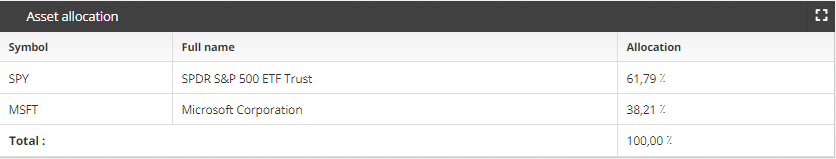
¶ 9. Asset allocation table
- Here you can check portfolio asset allocation in percentage terms
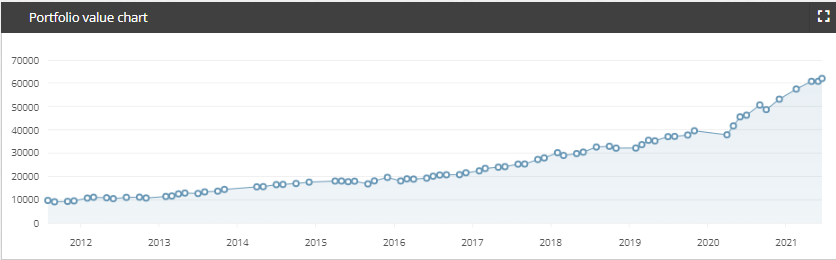
¶ 10. Portfolio value chart for given period
- Show's a hypothetical 10000$ investment for this portfolio and for this given period
Create your account for free - start here https://my.fintrek.app/register.
If you have any questions please send us a message or an email at @mailto:support@fintrek.app